 en
en br
brMonitoring in HQBird
Monitoring in HQbird
HQbird implements 2 approaches for performance monitoring:- Advanced Monitoring - continious monitoring which collects data from Trace API, MON$, lock-table, transactions, CPU, RAM, etc, and represents them as a set of per-minute graphs, with detailization of all important metrics for EVERY minute. The data are becoming available with 1-2 minutes delay (for processing), they are available both locally in HQbird interface on port 8083, and, optionally, can be sent to HQCenter for centralized monitoring.
- Performance Trace Reports - in-depth analysis of trace logs, which requires trace log collection during the day, for example. Performance report is used for the analysis of statistical impact of very frequent queries, long queries, etc. Performance Trace Report is also available for subscribers of certain plans on Firebird Configuration Calculator portal (cc.ib-aid.com)/
1. Advanced Monitoring in HQbird
In order to access Advanced Monitoring in HQbird, open web-interface on port 8083 (i.e., localhost:8083), with the same username and password, as main interface.We recommend to watch the video below to see how to configure and use Advanced Performance Monitoring in HQbird.
2. Performance Trace Reports
HQbird has the automatic scheduled collection of performance trace reports to identify problematic (slow, frequent, etc) SQL queries. These performance reports are available also for users of vanilla Firebird with subscriptions on Firebird Configuration Calculator portal (cc.ib-aid.com).With HQbird, it is possible to schedule the regular collection of database performance data in less than 1 minute. If you use vanilla Firebird, follow this instruction.
In HQbird, open tab Performance (at the left of main interface localhost:8082) and set up monitoring for queries for all database on server: choose HQbird server level trace, configuration icon.

In order to setup Performance monitoring, specify its mandatory parameters in the dialog:

The first mandatory parameter is «Enable performance monitoring» - it must be enabled to run traces by schedule. The next important parameters are «Start trace session at» and «Stop trace session». They contain CRON expressions which specify when tracing starts and stops.
By default, the trace is set to start at 10-30 and to end at 11-00. It is recommended to adopt a tracing schedule for your needs. Below you can see the table with some popular options.
| CRON expression for | Description | |
|---|---|---|
| Start | End | |
| 0 0 * ? * * | 0 10 * ? * * | Run trace every hour from 0 to 10 minutes |
| 0 0 8 ? * * | 0 0 17 ? * * | Run trace every day from 8-00 to 17-00 |
| 0 30 10,13,15 ? * * | 0 0 11,14,16 ? * * | Run trace sessions every day from 10-30 to 11-00, 13-30 to 14-00 and from 15-30 to 16-00 |
The next important parameter is time threshold for the slow queries, it is set in the field «SQLs duration limit». In this field you need to set time threshold (in milliseconds), after exceeding it logs will be stored and analyzed. By default, the time is set to 1000 milliseconds or 1 second. It means, that only queries which take more than 1 seconds, will be logged and analyzed.
We recommend set 50 ms as a starting value, and try to decrease it to 1ms and then to 0ms in the next days. Return to 50ms if collected trace data will become too big (more than 5Gb per day, for example).
«Send email» checkmark indicates if there is a necessity to send the performance report. The email settings from Alerts configuration will be used to send performance report.
For more advanced settings, «Performance Monitoring» dialog has additional parameters (normally, you don't need to adjust them initially).

Most important parameters are:
- «Configuration template» - the name of the configuration template file which should be used for trace settings
- «Database filter» - how the database should be identified. Usually AUTO is enough, it will trace the specified database. In the case of Filename or Alias, it will use filename or alias to filter database events. «Manual» provides an ability to set any regular expression, to trace several databases, for example, or more than one alias for the single database.
- «Database name filter» it is used in case of «MANUAL» selection.
- «Trace format» - AUTO means automatic selection, 2.5 or 3.0 will force format for 2.5 or 3.0. Usually, there is no need to change it.
- «Keep recent reports» - it specifies how many reports should be kept in the «Output folder» for possible retrospective usage.
- Other parameters are described in HQbird User Guide
Also, the most recent performance is available for review and download in the HQBird interface:
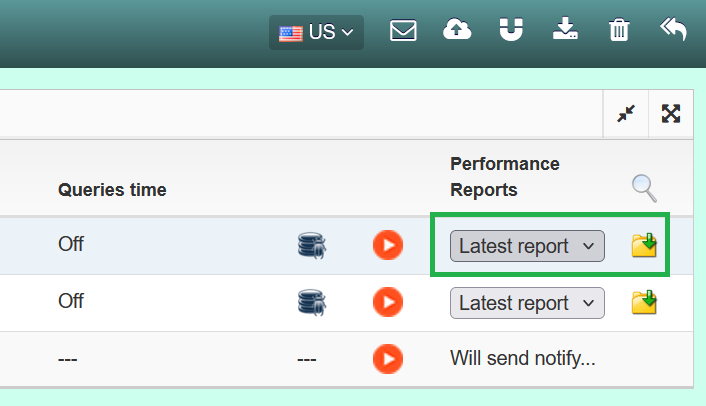
It is possible to view report in the interface of HQbird, or download as a separate file.
The ready report will look like this:
