 en
en br
brHow to interprete performance report
Using HQbird, or, as a separate service, IBSurgeon Performance Analysis from cc.ib-aid.com, you can generate a performance report from Firebird trace logs.
This report is a powerful diagnostic tool that provides detailed information about SQL query execution in Firebird databases. This guide explains how to interpret and use trace reports to identify and resolve performance bottlenecks systematically.
1. Performance Report Structure
┌─────────────────────────────────────────┐
│         Performance Report              │
├─────────────────────────────────────────┤
│ 1. Performance Summary Graphs           │
│    ┌────────────────────────┐           │
│    │  Top queries	      │           │
│    │     Top summary	      │           │
│    │     Top frequency      │           │
│    │     Durations          │           │
│    │     Fetches  	      │           │
│    │     Reads	      │           │
│    │     Writes	      │           │
│    │  Time Series Chart     │           │
│    │     Durations          │           │
│    │     Count of queries   │           │
│    │     Fetches            │           │
│    │     Reads/Writes       │           │
│    └────────────────────────┘           │
├─────────────────────────────────────────┤
│ 2. Top Queries Analysis                 │
│    ┌────────────────────────┐           │
│    │ Query Rankings         │           │
│    │                        │           │
│    │  By Duration───┐       │           │
│    │                │       │           │
│    │  By Time   ────┤       │           │
│    │  Summary       │       │           │
│    │                │       │           │
│    │  By Plan   ────┤       │           │
│    │  Summary       │       │           │
│    │                │       │           │
│    │  By Frequency ─┤       │           │
│    │                │       │           │
│    │  By Plan    ───┤       │           │
│    │  Frequency     │       │           │
│    │                │       │           │
│    │  By Fetches ───┤       │           │
│    │                │       │           │
│    │  By Reads   ───┤       │           │
│    │                │       │           │
│    │  By Writes  ───┘       │           │
│    │                        │           │
│    └────────────────────────┘           │
├─────────────────────────────────────────┤
│ 3. Process Summary                      │
│    ┌────────────────────────┐           │
│    │ Per Process Stats      │           │
│    │ - Execution counts     │           │
│    │ - Fetches, etc	      │           │
│    │ - Duration metrics     │           │
│    └────────────────────────┘           │
├─────────────────────────────────────────┤
│ 4. Address Summary                      │
│    ┌────────────────────────┐           │
│    │Per Client Address Stats│           │
│    │ - Connection counts    │           │
│    │ - Durations  	      │           │
│    │ - Fetches,etc          │    	  │
│    │ - Process names        │ 	  │
│    └────────────────────────┘           │
└─────────────────────────────────────────┘

Query Details Structure:
┌────────────────────┐
│ Query Information  │
├────────────────────┤
│ - SQL Text         │
│ - Transaction info │
│ - Execution Plan   │
│ - Duration Stats   │
│ - Resource Stats   │
│   * Fetches        │
│   * Reads          │
│   * Writes         │
│   * Marks          │
│ - Client Info      │
└────────────────────┘
The performance report provides a hierarchical view of database activity:
-
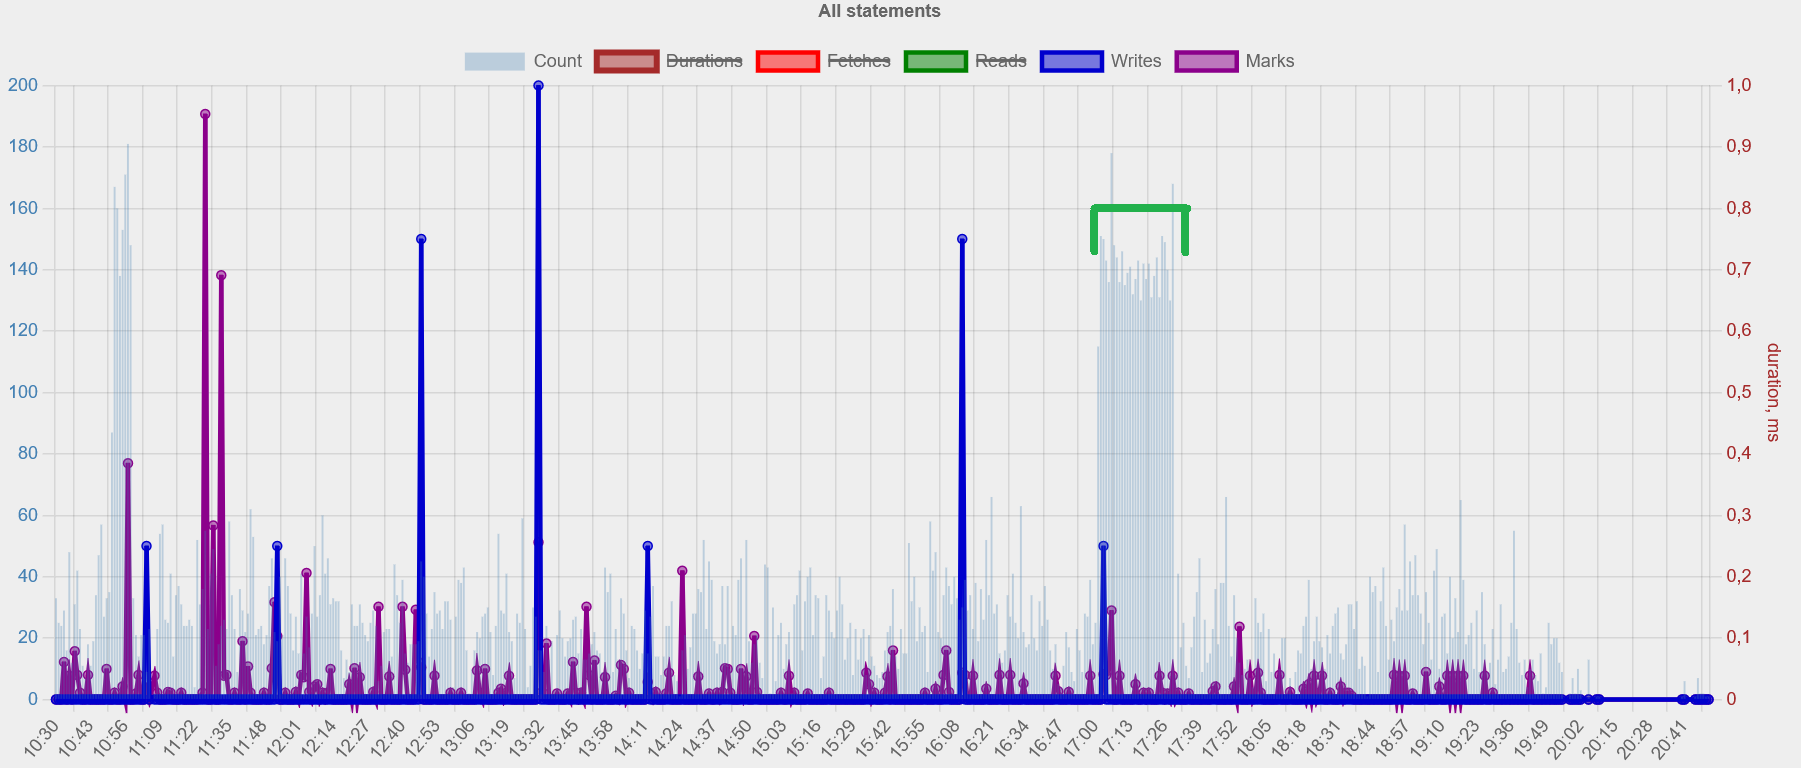
Performance Summary Graphs
-
Visual representation of key metrics over time - you can easily see peaks of activity/load. (There is also per-minute analysis report available in the Advanced Performance Monitoring in HQbird, the shortened version of it is available on the Portal tool - see this video for details).
-
Helps identify patterns and anomalies: comparing graphics from the periods with good performance (e.g., last week/month) with performance problems can help identify problem.
-
-
Top Queries Analysis
-
Multiple ranking perspectives for comprehensive analysis: the longest queries, the most frequent queries, the most time-consuming queries (grouped by the text or plan), and more.

-
Each dimension reveals different optimization opportunities
-
Detailed statistics for each query including:
-
Duration metrics (min, max, avg, median)
-
Resource consumption (fetches, reads, writes)
-
Execution patterns - number of origins for the top queries.
-
-
-
Process Summary
-
Groups statistics by executing process
-
Helps identify problematic applications
-
Shows resource consumption and database operations (connections, queries, etc) and metrics (fetches, reads, etc) per process
-
-
Address Summary
-
Groups statistics by client connection
-
Reveals load distribution across clients
-
Helps identify connection-specific issues
-
Each section supports performance analysis at different levels:
-
System-wide patterns (Graphs) - see when and where problems occur in general.
-
Most noticieable impact from queries (Top Queries) - identify queries which should be optimized first.
-
Application-level issues (Process Summary) - identify applications which produce performance problems.
-
Client-level problems (Address Summary) - identify IP-addresses (workstations, clients computers) with the biggest flow of queries.
2. Time Summary and Plan-Summary Analysis
It is recommended to start an analysis of situation with performance with Summary sesctions. Click here to open Plan-Summary section in the example report.
Time Summary aggregates the total execution time for each unique SQL statement pattern.
Think of it as a "cost center" report that shows which queries are consuming the most database resources over time.
If queries are not parametrized, i.e., explicitly contain paramaters' values inside the SQL text instead parameters placeholder (:myparam1), it is necessary to use section "Plan-Summary" to identify queries with the top frequency.
Example of non parametrized query: 'SELECT * FROM COUNTRY WHERE COUNTRYID=2'
Example of parametrized query: 'SELECT * FROM COUNTRY WHERE COUNTRYID=:paramid'
Each query in Summary section has the header with following key parts:

-
Summary: Total time percentage, it shows what portion of overall database time a query consumes.
-
Frequency: How many times the query pattern appears
-
Fetch, Read,Write: resource metrics
For example, if there is
Summary: 19.08% (3920272 of 20541791 ms)
This tells us this query pattern is consuming almost 20% of total database time - a significant portion that warrants immediate attention.
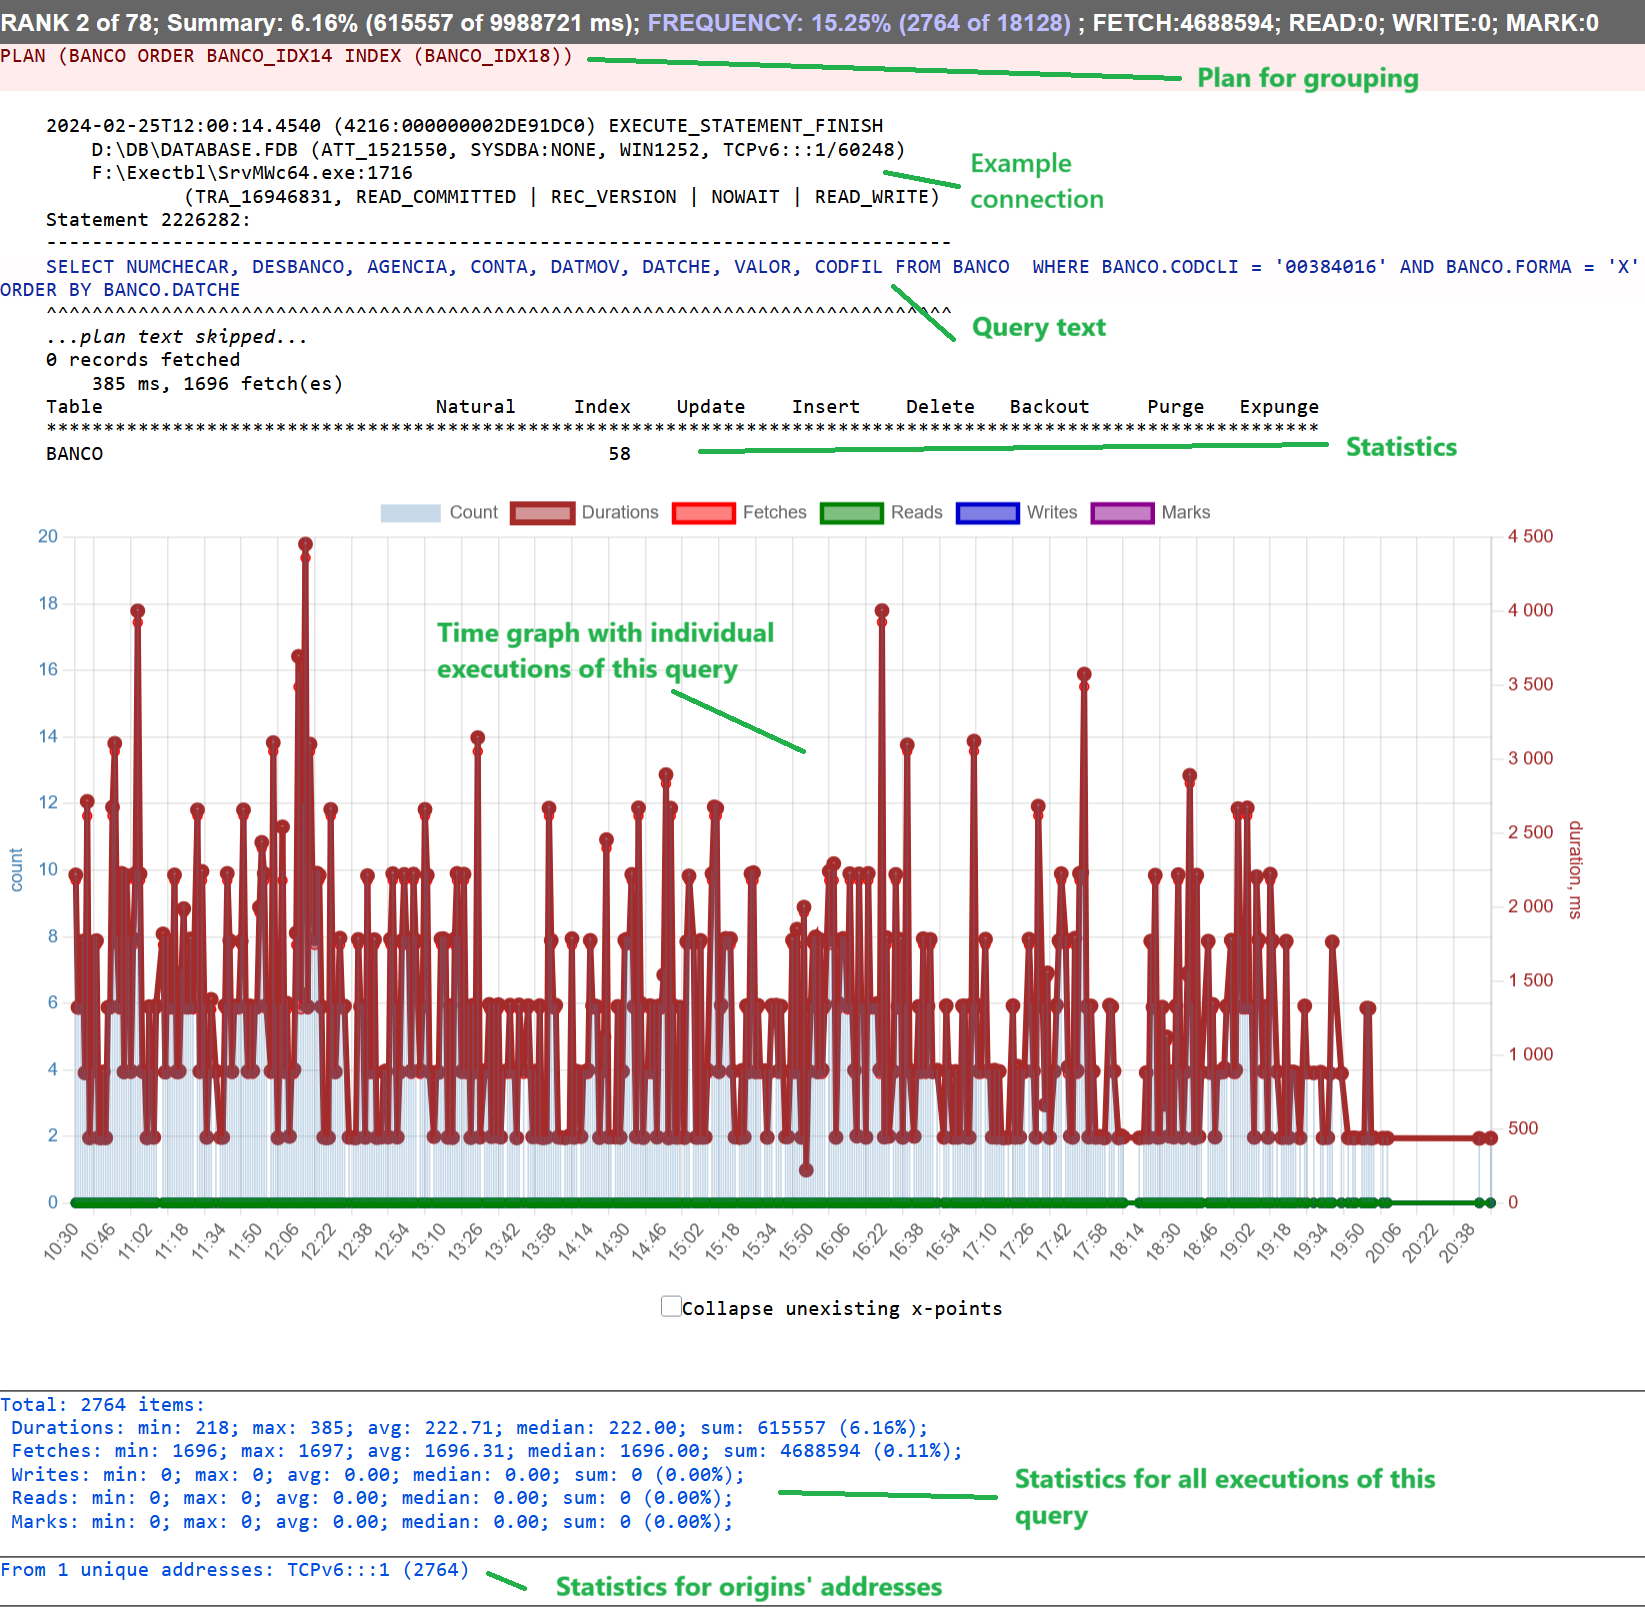
Below header in Plan-Summary section we will see SQL execution plan, which was used to group queries, in Time-Summary it will be text of query itself.
Since query pattern represents more than one specific query, the information specific about connection is taken from the first query which corresponds the pattern:
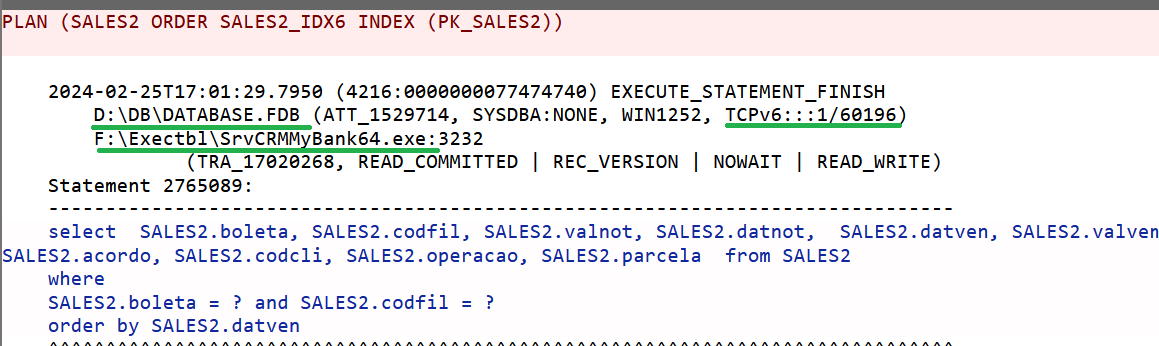
On the screenshot above you can see the header of example statement for the pattern, it consists of the application name which started this SQL, ID of connection and ID of transaction, as well as IP address, and transaction's details.
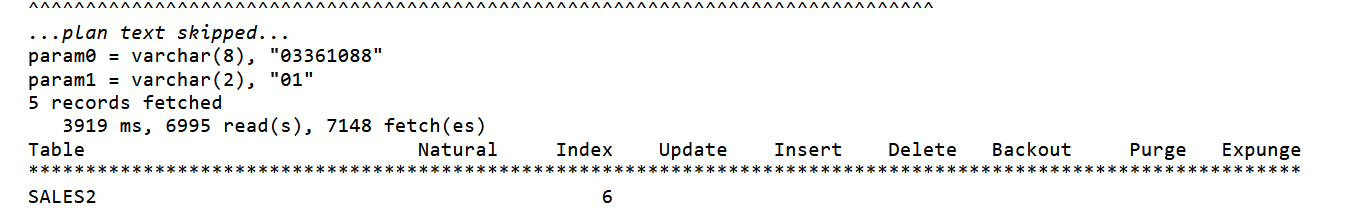
Below goes plan (for Time-Suammry, for Plan-Summary it is skipped because it is already shown in the beginning), parameters values (in the order of appearance), and per-table statistics:
Please remember, in Plan-Summary we group SQLs using execution plan, it means that only plan is persistent for the pattern, and for Time-Summary we group using SQL statement text, and other things (parameters values, execution times, etc) can be different Use this information as example of the execution pattern (in 99% cases it is enough to reproduce the problem).
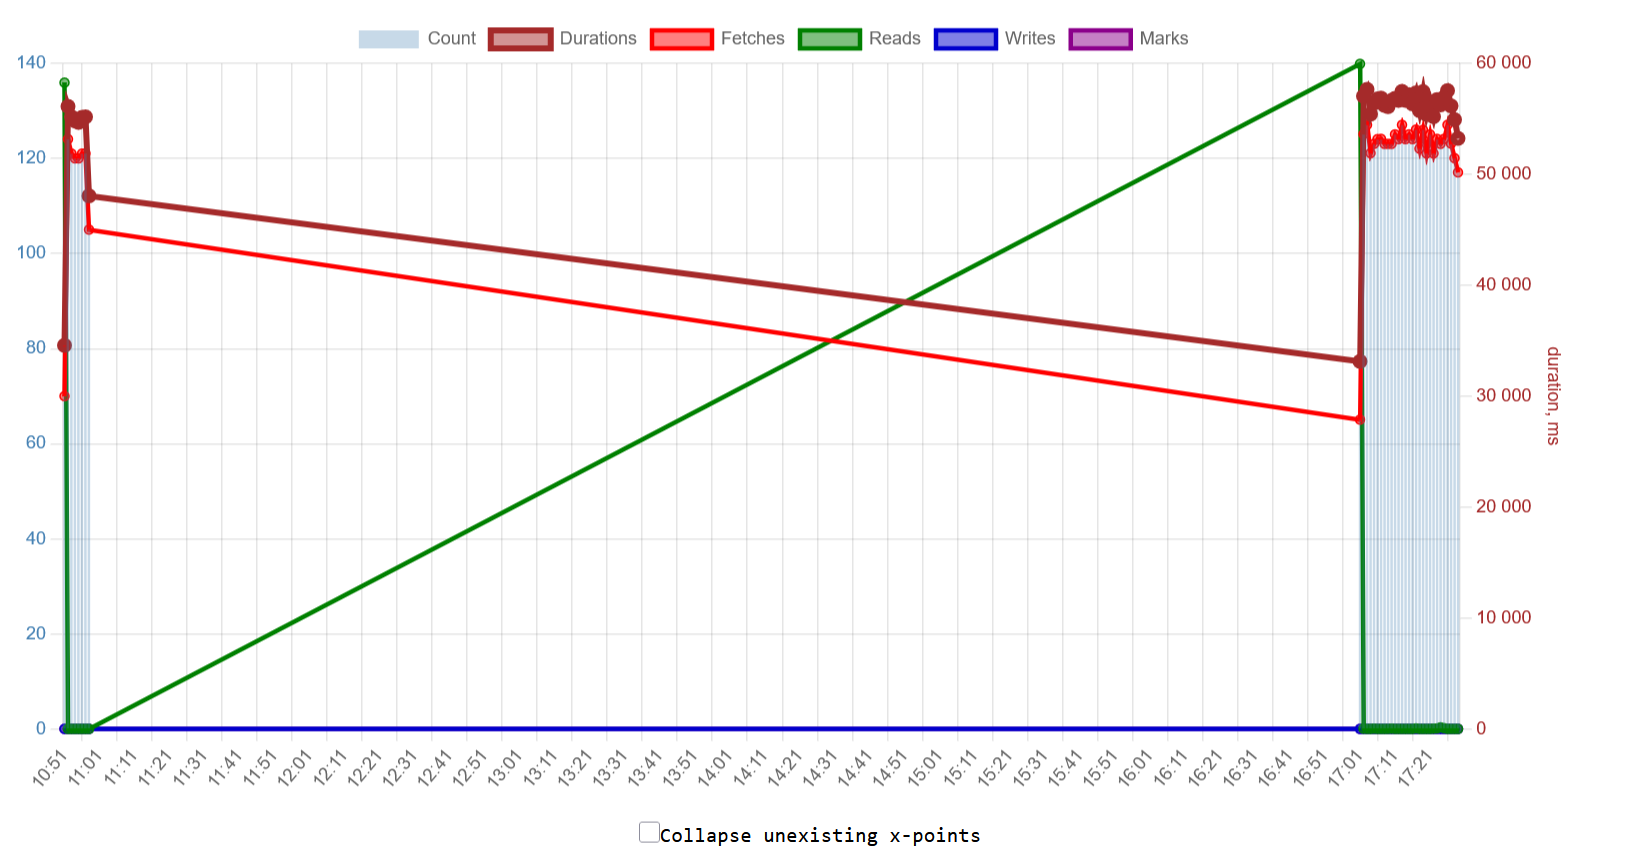
Below we have individual graph with executions of this specific query. As you can see, this query was started in the period of high load which we noticed on the overview graph.
And, in the end we have very important collection of statistics for ALL queries which correspond the pattern, and list of origin's addresses:
In this statistics, we can see minimum, maximum, average and median execution times, the sames statistics for fetches, reads, writes, and marks (cache flush operations).
2.1. How to Use Time Summary:
-
First identify queries consuming disproportionate time (they are top 3 of this section - #1, 2, 3)
-
Compare time consumption against frequency
-
See average execution time (total time / frequency) in the bottom of query’s section (see below)
-
Look for patterns where:
-
High time + Low frequency = Inefficient individual queries
-
High time + High frequency = Potentially inefficient but heavily used queries
-
3. Frequency Analysis: Frequency and Plan-Frequency
Use frequency analysis to understand how often queries run. Think of it like counting how many times a particular road gets used during rush hour.
If queries are not parametrized, i.e., explicitly contain paramaters' values inside the SQL text instead parameters placeholder (:myparam1), it is necessary to use section "Plan-Summary" to identify queries with the top frequency.
Example of non parametrized query: 'SELECT * FROM COUNTRY WHERE COUNTRYID=2'
Example of parametrized query: 'SELECT * FROM COUNTRY WHERE COUNTRYID=:paramid'
3.1. Understanding Frequency Impact
Representation of Frequency query pattern is very similar to Plan/Time Summary:
High-frequency queries are like busy intersections - even if each car (query) moves quickly, the sheer volume can cause congestion. This affects:
-
Database connections (like parking spaces - limited in number)
-
Network bandwidth (like road capacity)
-
CPU usage (like traffic controllers getting overwhelmed)
-
Cache efficiency (like having to repeatedly access the same information)
To estimate impact of high-frequency queries, collect trace with parameter threshold = 0.
3.2. Frequency Impact Categories
| Executions/second | Impact Level | Potential Issues |
|---|---|---|
|
>1000 |
Critical |
Like rush hour traffic - system resources get overwhelmed |
|
100-1000 |
High |
Similar to steady traffic flow - significant but manageable load |
|
10-100 |
Medium |
Like occasional traffic - monitor for patterns |
|
<10 |
Low |
Light traffic - minimal impact unless queries are very slow |
|
High frequency isn’t always bad - if queries are well-optimized, they can run frequently without issues. The key is ensuring they’re as efficient as possible. Practilly, it means that query median execution time for top 3 most frequent queries should be 0 milliseconds (i.e., less than 1ms), and do not exceed 50% of total executions of queries. |
3.3. Example Analysis
Let’s examine a real case from our trace report:
Frequency: 4,428 executions (24.43% of total)
Impact: Critical - high volume of SALES table queries
Root Cause: Repetitive customer balance checks
Optimization Priority: High

Explanation: This query is running thousands of times, similar to a
busy intersection. Even though each execution might be quick, the
cumulative impact is significant. The application might be checking
balances more often than necessary.
4. Analysis of statistics of top queries in xx-Summary and Frequency sections
When analyzing Firebird trace reports, each query grouping contains detailed aggregate statistics that provide crucial insights into performance patterns. Let’s break down each metric and understand its significance for database optimization.
4.1. Aggregate Statistics Analysis
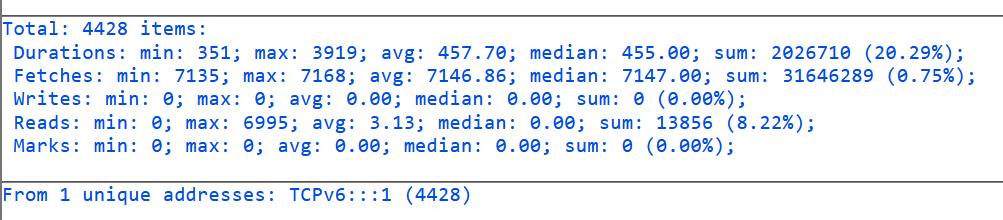
Let’s examine this example set of statistics:
Total: 4428 items:
Durations: min: 351; max: 3919; avg: 457.70; median: 455.00; sum: 2026710 (20.29%);
Fetches: min: 7135; max: 7168; avg: 7146.86; median: 7147.00; sum: 31646289 (0.75%);
Writes: min: 0; max: 0; avg: 0.00; median: 0.00; sum: 0 (0.00%);
Reads: min: 0; max: 6995; avg: 3.13; median: 0.00; sum: 13856 (8.22%);
Marks: min: 0; max: 0; avg: 0.00; median: 0.00; sum: 0 (0.00%);
From 1 unique addresses: TCPv6:::1 (4428)
4.2. Execution Count Analysis
4.2.1. Total Items
Total: 4428 items
This represents the number of times this particular query pattern was executed during the trace period.
Understanding this number helps you:
-
Calculate per-execution resource usage
-
Determine if query caching might be beneficial (or simply run it less frequently)
High execution counts might indicate opportunities for:
-
Implementing prepared statements (and parametrized) - the same query with the same frequency, when parametrized and prepared for repetitive execution, will require less resources
-
Adding result caching - caching resulted value for the use during the long operation or even longer, for user’s session, can reduce necessity to frequently execute query
-
Batching operations - consider to execute query to return or process many records at once, it will eliminate the overhead for executing query (preparation, network transmission, etc).
4.3. Duration Metrics
4.3.1. Duration Components Example
Durations: min: 351; max: 3919; avg: 457.70; median: 455.00; sum: 2026710 (20.29%);
|
Metric |
Value |
Significance |
|
Minimum |
351ms |
Best-case execution time, useful for understanding optimal conditions |
|
Maximum |
3919ms |
Worst-case execution time, helps identify potential problems |
|
Average |
457.70ms |
Typical execution time, but can be skewed by outliers |
|
Median |
455.00ms |
Middle value, often more representative than average for skewed distributions |
|
Sum (%) |
2026710 (20.29%) |
Total time consumed and percentage of overall trace duration |
4.3.2. Duration Analysis
-
Close median and average (457.70 vs 455.00 ms) suggests consistent performance
-
Max/min ratio (~11x) indicates some variability
-
20.29% of total time is significant - is this query in the top 3 in Frequency or Plan-Frequency section? (yes, it is.)
4.4. Resource Usage Metrics
4.4.1. Fetch Operations
Fetches: min: 7135; max: 7168; avg: 7146.86; median: 7147.00; sum: 31646289 (0.75%);
Fetches represent row retrievals:
-
Consistent fetch counts (min/max difference of only 33) suggest stable result sets
-
Relatively high fetch counts (>7000 per execution) might indicate:
-
Need for result set limiting and/or pagination, if there are many records returned.
-
Potential for query optimization - especially makes sense if query is in top 3 of Frequency/Plan-Frequency.
-
4.5. Read Operations
Reads: min: 0; max: 6995; avg: 3.13; median: 0.00; sum: 13856 (8.22%);
Physical reads indicate disk access:
-
Zero median with non-zero maximum suggests occasional cache misses
-
8.22% of total reads indicates moderate I/O impact
-
Large gap between min (0) and max (6995) suggests variable cache effectiveness.
4.6. Write Operations
Writes: min: 0; max: 0; avg: 0.00; median: 0.00; sum: 0 (0.00%);
If query performs no writes, usually it’s a read-only operation.
4.7. Mark Operations
Marks: min: 0; max: 0; avg: 0.00; median: 0.00; sum: 0 (0.00%);
Mark operations relate to data pages cache management:
-
Zero marks indicate no data page was marked for flushing, common for simple SELECT queries
-
Non-zero marks operation with cache
4.8. Client Connection Analysis
From 1 unique addresses: TCPv6:::1 (4428)
This shows query source distribution:
-
Single client address suggests application-specific query
-
Local connection (::1 is IPv6 localhost)
-
All 4428 executions from same source
4.9. Using These Metrics for Optimization
4.9.1. Performance Pattern Analysis
Execution Consistency
-
Compare min/max durations
-
Look for outliers in resource usage
-
Check median vs average for variability
Resource Usage Patterns
-
High fetches → Review result set size
-
High reads → Check index coverage
-
High marks → Examine lock contention
Client Impact Analysis
-
Multiple clients → Connection pool sizing
-
Single client → Application optimization
4.9.2. Optimization Priorities
Based on these metrics, prioritize:
-
Result Set Size
-
7000 fetches per execution
-
Consider adding LIMIT/OFFSET
-
Review SELECT column list
-
Caching Strategy
-
Frequent execution (4428 times)
-
Consistent result size
-
No writes involved
Probably, this query can be executed less frequently.
Index Usage
-
Variable read counts
-
Zero median reads but high maximum
-
Review index coverage
5. Practical Application
For this specific example:
Short-term Improvements:
-
Implement result caching (high execution count, consistent fetches)
-
Review result set size (>7000 fetches per execution)
Medium-term Optimization:
-
Analyze index usage patterns
-
Consider prepared statement usage
-
Review application logic for execution frequency
Long-term Considerations:
-
Monitor execution patterns over time
-
Plan index maintenance strategy
-
Consider data access pattern changes
| Remember that these metrics should be analyzed together, not in isolation. A high number in one category might be acceptable if other metrics are optimal. This comprehensive understanding of trace metrics enables informed decision-making for database optimization strategies. |
6. Duration Analysis
Duration analysis examines how long individual queries take to execute. Think of duration like a stopwatch timing each query - the longer a query takes, the more likely it is to cause performance issues.
6.1. Understanding Duration Metrics
Duration metrics are crucial because they directly affect users' experience, i.e., users claim "system is slow". Just as customers get frustrated waiting in a long line, users become frustrated when queries take too long to complete. Long-running queries cause:
-
Poor user experience when screens take too long to load
-
System resource tied up for extended periods
-
Other queries waiting in line behind slow ones
-
Potential timeout issues in applications
6.2. Impact Categories
| Duration Range | Impact Level | Recommended Action |
|---|---|---|
|
>10 seconds |
Critical |
These queries are like traffic accidents on a highway - they block everything behind them and need immediate attention |
|
1-10 seconds |
High |
Like yellow traffic lights, these queries are warning signs that need attention soon |
|
100ms-1 second |
Medium |
Similar to slow-moving traffic, these queries need monitoring but aren’t critical |
|
<100ms |
Low |
These queries are flowing smoothly and only need attention if they occur very frequently |
6.3. Example Analysis
Duration: 77,793ms Impact: Critical - single query consuming 77.7 seconds Root Cause: Complex aggregation inPRC_COLLECT_RANKCATEGORYOptimization Priority: Immediate Explanation: This query is taking over a minute to execute, which is like a complete traffic stoppage. The stored procedure is likely processing too much data or using inefficient algorithms.
7. Implementation Strategy
Think of optimization like improving a transportation system - you need to identify problems, plan solutions, and implement changes carefully.
7.1. Prioritization Matrix
This matrix helps you decide what needs attention first, like triaging traffic problems in a city:
| Metric | High Impact | Medium Impact | Low Impact |
|---|---|---|---|
|
Duration |
Traffic jam (>10s) |
Slow traffic (1-10s) |
Flowing smoothly (<1s) |
|
Frequency |
Rush hour (>1000/sec) |
Steady traffic (100-1000/sec) |
Light traffic (<100/sec) |
|
Fetches |
Moving warehouse (>10M) |
Large shipment (1M-10M) |
Small delivery (<1M) |
|
Reads |
City-wide search (>100K) |
Neighborhood search (10K-100K) |
Street search (<10K) |
7.2. Step-by-Step Optimization Process
-
Identify Critical Queries
-
Look for the biggest traffic jams (slow queries)
-
Find the busiest intersections (high-frequency queries)
-
Spot inefficient routes (high resource usage)
-
-
Analyze Execution Plans
-
Study current routes (index usage)
-
Examine traffic patterns (join methods)
-
Check bottlenecks (sort operations)
-
-
Implement Optimizations
-
Build new roads (indexes)
-
Redesign routes (restructure queries)
-
Add shortcuts (caching)
-
-
Verify Improvements
-
Measure new traffic flow (new trace report)
-
Compare before/after metrics
-
Document what worked
-