en
en br
brLibrary
How to collect Firebird trace for IBSurgeon Performance Analysis
Please note: tracing is safe, it can be started on the production, it does not affect the performance in case of using the recommended configuration below.
- Em Portuguese - Como coletar Firebird Trace para IBSurgeon Performance Analysis?
- In deutscher Sprache – Wie erfasse ich Firebird-Tracees für die IBSurgeon-Leistungsanalyse?
This instruction describes usage of IBSurgeon Performance Analysis (part of cc.ib-aid.com subscription) for users of vanilla Firebird (for users of HQbird it is available in the interface on tab "Performance").
Tracing for Firebird 5.0, 4.0, and 3.0
Step 1 - Configuration file
Copy the following configuration into the file fbtrace30.conf, or download the ready file from here.
database
{
	enabled = true
	time_threshold = 100
	log_connections = true
	log_statement_finish = true
	log_errors = true
	log_initfini = false
	print_plan = true
	#explain_plan = false
	print_perf = true
	max_sql_length = 65000
	max_arg_length = 240
	max_arg_count = 50
}
Store the file in the folder without spaces, for example, C:\temp\fbtrace30.conf, or /opt/fbtrace30.conf
Step 2 - Test the configuration
Run fbtracemgr to check that configuration works:Windows
Open command prompt (run cmd.exe), go to the folder with Firebird (it can be C:\Program Files\Firebird\Firebird_3_0\ or C:\HQbird\Firebird30) and run (use your actual SYSDBA password instead of masterkey)fbtracemgr.exe -se localhost:service_mgr -user SYSDBA -pass masterkey -start -conf C:\temp\fbtrace30.conf
Linux
Run terminal, and then fbtracemgr from Firebird bin folder (/opt/firebird/bin or /usr/local/bin)./fbtracemgr -se localhost:service_mgr -user SYSDBA -pass masterkey -start -conf /opt/fbtrace30.confAs a result, you will see the output in the command prompt, something like this
Trace session ID 2 started
2021-05-26T10:23:48.5690 (2996:00000000018E0040) ATTACH_DATABASE
        C:\HQBIRD\FIREBIRD30\SECURITY3.FDB (ATT_6189, SYSDBA:NONE, NONE, )
Stop the tracing with Ctrl-C (and then Enter, if necessary).
Step 3 - Collect log
If you don't see errors in the previous step, run tracing to collect the output to the log file, c:\temp\log1.log in the example:Windows
fbtracemgr.exe -se localhost:service_mgr -user SYSDBA -pass masterkey -start -conf C:\temp\fbtrace30.conf > c:\temp\log1.log
Linux
./fbtracemgr -se localhost:service_mgr -user SYSDBA -pass masterkey -start -conf /opt/fbtrace30.conf > log1.logKeep it running to catch the problematic SQL queries for a while (the minimum is 3-4 minutes, recommended is 1 hour), and then interrupt the fbtracemgr with Ctrl-C.
Step 4. Upload logs
Upload the resulted log file to the Trace Visualization on cc.ib-aid.comPlease note, if the size of the log file is more than 20Mb, zip it (with standard Windows zip or with Linux zip or 7zip), and upload a compressed log instead.
Next Steps
See the example of log analysis here: https://ib-aid.com/articles/example-of-performance-analysisTracing for Firebird 2.5
Step 1 - Configuration file
Copy the following configuration into the file fbtrace25.conf, or download the ready file from here.<database> enabled true log_connections true log_statement_finish true log_errors true print_plan true print_perf true time_threshold 200 max_sql_length 65000 max_blr_length 500 max_dyn_length 500 max_arg_length 80 max_arg_count 50
</database>
Store the file in the folder without spaces, for example, C:\temp\fbtrace25.conf, or /opt/fbtrace25.conf
Step 2 - Test configuration
Run fbtracemgr to check that configuration works:Windows
Open command prompt (run cmd.exe), go to the Bin folder of the Firebird (it can be C:\Program Files\Firebird\Firebird_2_5\bin or C:\HQbird\Firebird25\bin) and run (use your actual SYSDBA password instead of masterkey)fbtracemgr.exe -se localhost:service_mgr -user SYSDBA -pass masterkey -start -conf C:\temp\fbtrace25.confAs a result, you will see the output in the command prompt, something like this
Trace session ID 2 started
2021-05-26T10:23:48.5690 (2996:00000000018E0040) ATTACH_DATABASE
        C:\HQBIRD\FIREBIRD30\SECURITY3.FDB (ATT_6189, SYSDBA:NONE, NONE, )
Linux
Run terminal, and then run fbtracemgr from Firebird bin folder (/opt/firebird/bin or /usr/local/bin)./fbtracemgr -se localhost:service_mgr -user SYSDBA -pass masterkey -start -conf /opt/fbtrace25.conf
Step 3 - Collect logs
If you don't see errors on the screen, run tracing to collect the output of the data to the file, c:\temp\log1.log in the example:Windows
fbtracemgr.exe -se localhost:service_mgr -user SYSDBA -pass masterkey -start -conf C:\temp\fbtrace25.conf > c:\temp\log1.log
Linux
./fbtracemgr -se localhost:service_mgr -user SYSDBA -pass masterkey -start -conf /opt/fbtrace25.conf > log1.logKeep it running to catch the problematic SQL queries for a while (the minimum is 3-4 minutes, recommended is 1 hour), and then interrupt the fbtracemgr with Ctrl-C.
Step 4. Upload results
Upload the resulted log file to the Trace Visualization on cc.ib-aid.comPlease note, compress the log file if it is bigger than 20Mb (with standard Windows zip or with Linux gz or 7zip), and upload compressed log instead. The size of the compressed log is limited to 1Gb, larger log files will be deleted.
You need to have an account to log in.
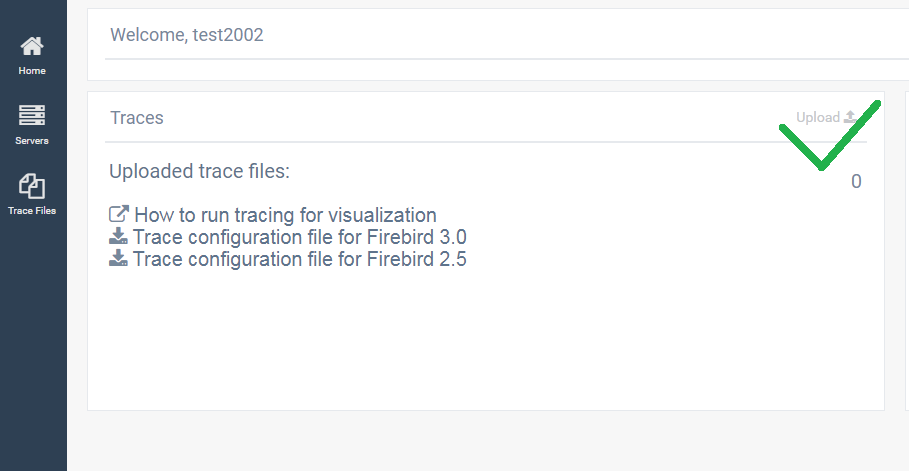
After login, click on "Upload " in the upper right corner of "Traces" widget:
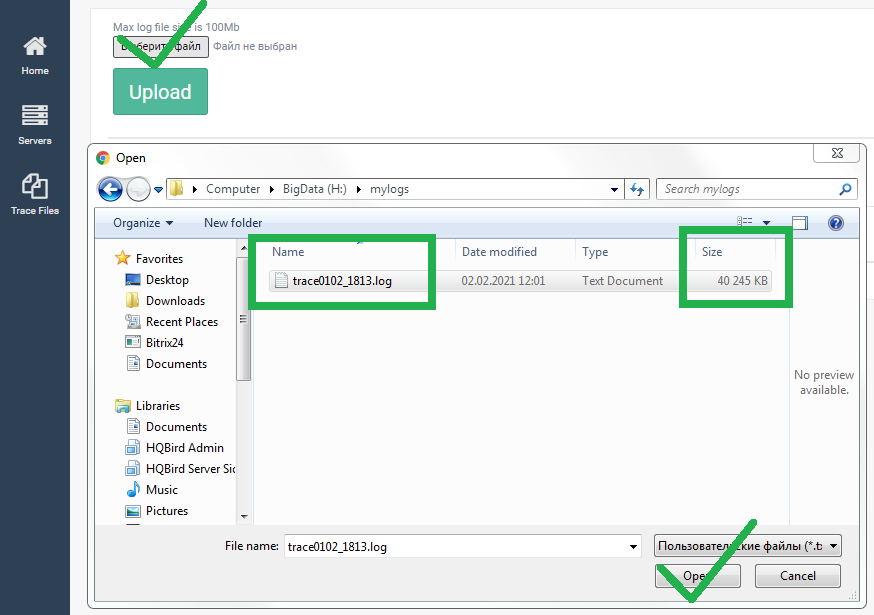
Then, select trace log file (max 120Mb) on disk, and click Upload:
Uploading can take 1-2 minutes, depending on your Internet connection upload speed and general connectivity. Compressed files are uploaded faster due to the reduced size!
Then you will see the uploaded file as being "Processing":
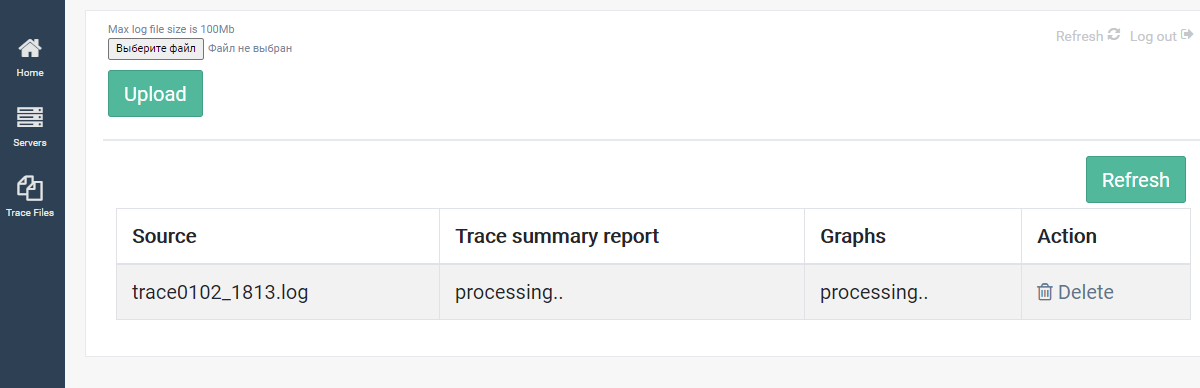
Processing usually takes 1-2 minutes. You need to use the button "Refresh" to see the status of the processing.
After processing is complete, you will see links to the performance summary report (column "Trace summary report", link "Html"), and to the graphical representation of tracing (column and link "Graphs"):
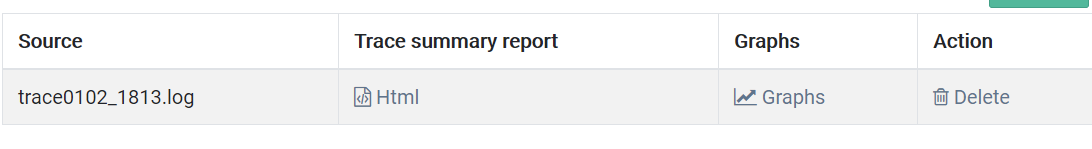
If you click on "Html", the new page with trace summary report will appear.
The report contains lists of top queries, sorted by duration (i.e., the longest queries), frequency (the most frequent queries), time-summary (SQL queries, which took the majority of time), fetches (most-CPU consuming queries), reads (disk reads), and writes (disk writes).
Also, there is a process summary, where you can see the applications consumed the majority of resources.

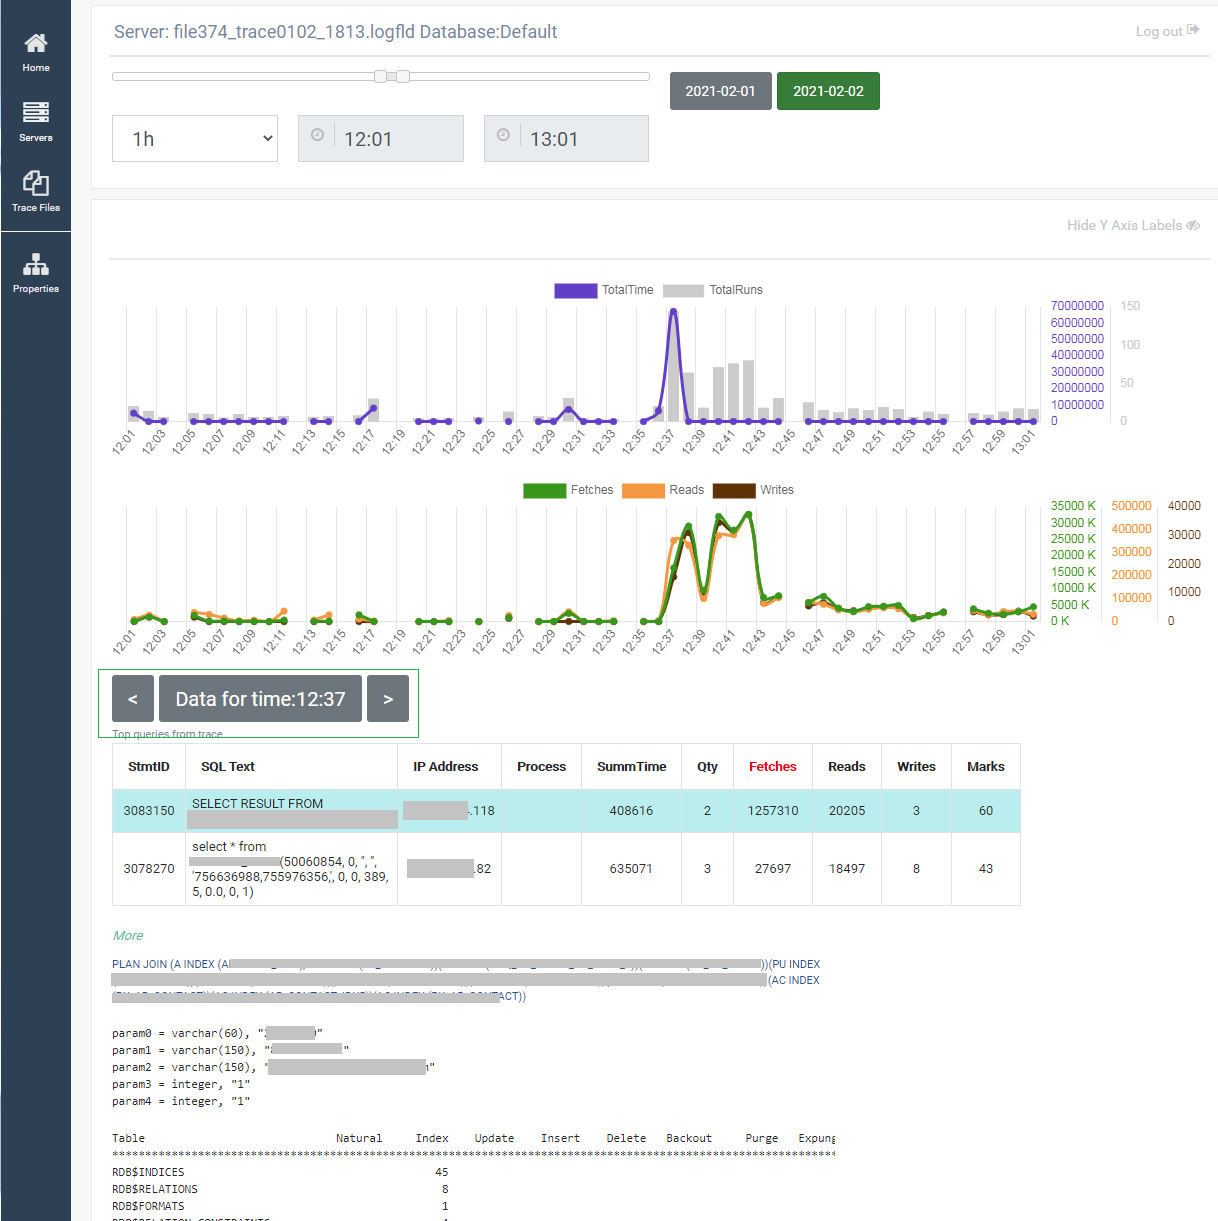
If you click on "Graphs", you will see the graphical representation of trace log, with top queries, grouped by every minute (by the finishing moment of queries execution).
If you click on the specific time moment, you will see top queries from trace log, their plan, parameters, statistics: