 en
enLibrary
IBAnalyst: Understanding Your Database
Dmitri Kuzmenko, [email protected], last update 31-March-2014
I have been working with InterBase since 1994. Back then, most databases were small, and did not require any tuning. Of course, there were occasions when I had to change ibconfig on a server, and reconfigured hardware or the OS, but that was almost all I could do to tune performance.
Four years ago, our company began to provide technical support and training of InterBase users. Working with many production databases also taught me a lot of different things. However, most of what I learned concerned applications - transaction parameters usage, optimizing queries and result sets.
Of course, I had known for quite some time about gstat - the tool that gives database statistics information. If you have ever looked in gstat output or read opguide.pdf about it, you would know that the statistical output looks like just a bunch of numbers and nothing else. Ok, you can discover fragmentation information for a particular table or index, but what other useful information can be obtained?
Thankfully, prior to working with InterBase, I was interested in different data structures, how they are stored and what algorithms they use. This helped me to interpret the output of gstat. At that time I decided to write a tool that could analyze gstat output to help in tuning the database or at least to identify the cause of performance problems.
Long story, but the outcome was that IBAnalyst was created. In spite of my experience it still allows me to find very interesting things or performance issues in different databases.
Real systems have runtime performance that fluctuates like a wave. The amplitude of such ‘waves’ can be low or high, so you can see how performance differs from day to day (or hour by hour). Actual performance depends on many factors, including the design of the application, server configuration, transaction concurrency, version garbage in the database and so on. To find out what is happening in a database (both positive and negative aspects of performance) you should at the very least take a peek at the database statistics from time to time.
Real systems have runtime performance that fluctuates like a wave. The amplitude of such ‘waves’ can be low or high, so you can see how performance differs from day to day (or hour by hour). Actual performance depends on many factors, including the design of the application, server configuration, transaction concurrency, version garbage in the database and so on. To find out what is happening in a database (both positive and negative aspects of performance) you should at the very least take a peek at the database statistics from time to time.
Let’s take a look at the capabilities of IBAnalyst. IBAnalyst can take statistics from gstat or the Services API and compile them into a report giving you complete information about the database, its tables and indices. It has in-place warnings which are available during the browsing of statistics; it also includes hint comments and recommendation reports.
Database Information
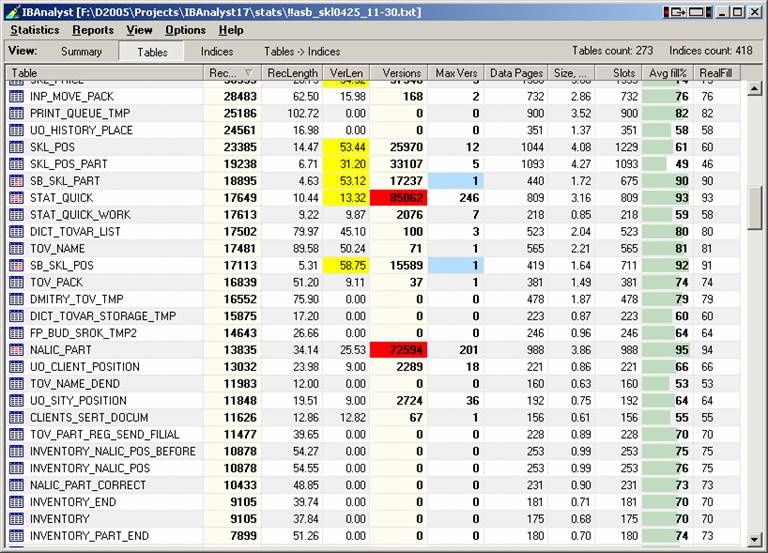
Figure 1 Summary of database statistics
The summary shown in Figure 1 provides general information about your database. The warnings or comments shown are based on carefully gathered knowledge obtained from a large number of real-world production databases.
Note: All figures in this article contain gstat statistics which were taken from a real-world production database (with the permission of its owners).
As I said before, raw database statistics look cryptic and are hard to interpret. IBAnalyst highlights any potential problems clearly in yellow or red and the deWhat can we discover from the above figure? This is a dialect 3 database with a page size of 4096 bytes. Six to eight years ago developers used a default page size of 1024 bytes, but in more recent times such a small page size could lead to many performance problems. Since this database has a page size of 4k, there is no warning displayed, as this page size is okay.tail of the problem can be read simply by placing the cursor over the relevant entry and reading the hint that is displayed.
Next, we can see that the Forced Write parameter is set to OFF and marked red. InterBase 4.x and 5.x by default had this parameter ON. Forced Writes itself is a write cache method: when ON it writes changed data immediately to disk, but OFF means that writes will be stored for unknown time by the operating system in its file cache. InterBase 6 creates databases with Forced Writes OFF.
Why is this marked in red on the IBAnalyst report? The answer is simple - using asynchronous writes can cause database corruption in cases of power, OS or server failure.
Tip: It is interesting that modern HDD interfaces (ATA, SATA, SCSI) do not show any major difference in performance with Forced Write set On or Off(1).
Next on the report is the mysterious “sweep interval”. If positive, it sets the size of the gap between the oldest (2) and oldest snapshot transaction, at which the engine is alerted to the need to start an automatic garbage collection. On some systems, hitting this threshold will cause a “sudden performance loss” effect, and as a result it is sometimes recommended that the sweep interval be set to 0 (disabling automatic sweeping entirely). Here, the sweep interval is marked yellow, because the value of the sweep gap is negative, which it can be in InterBase 6.0, Firebird and Yaffil statistics but not in InterBase 7.x. When the value of the sweep gap is greater than the sweep interval (if the sweep interval is not 0) the report entry for the sweep interval will be marked red with an appropriate hint.
We will examine the next 8 rows as a group, as they all display aspects of the transaction state of the database:
- The oldest transaction is the oldest non-committed transaction. Any lower transaction numbers are for committed transactions, and no record versions are available for such transactions. Transaction numbers higher than the oldest transaction are for transactions that can be in any state. This is also called the “oldest interesting transaction”, because it freezes when a transaction is ended with rollback, and server can not undo its changes at that moment.
- The oldest snapshot - the oldest active (i.e., not yet committed) transaction that existed at the start of the transaction that is currently the Oldest “interesting” Transaction. Indicates lowest snapshot transaction number that is interested in record versions.
- The oldest active - the oldest currently active transaction (3).
- The next transaction - the transaction number that will be assigned to new transaction
- Active transactions - IBAnalyst will give a warning if the oldest active transaction number is 30% lower than the daily transactions count The statistics do not tell if there any other active transactions between oldest active and next transaction, but there can be such transactions.. Usually, if the oldest active gets stuck, there are two possible causes: a) that some transaction is active for a long time or b) the application design allows transactions to run for a long time. Both causes prevent garbage collection and consume server resources.
- Transactions per day - this is calculated from next transaction, divided by the number of days passed since the creation of the database to the point where the statistics are retrieved. This can be correct only for production databases, or for databases that are periodically restored from backup, causing transaction numbering to be reset.
It should be noted that database statistics are not always useful. Statistics that are gathered during work and housekeeping operations can be meaningless.
Do not gather statistics if you:
- Just restored your database
- Performed backup (gbak -b db.gdb) without the -g switch
- Recently performed a manual sweep (gfix -sweep)
How can you tell when there is something wrong with the database?
Your applications can be designed so well that they will always work with transactions and data correctly, not making sweep gaps, not accumulating a lot of active transactions, not keeping long running snapshots and so on. Usually it does not happen (sorry, colleagues).The most common reason is that developers test their applications running only two or three simultaneous users. When the application is then used in a production environment with fifteen or more simultaneous users, the database can behave unpredictably. Of course, multi-user mode can work okay because most multi-user conflicts can be tested with two or three concurrently running applications. However, with larger numbers of users, garbage collection problems can arise. Such potential problems can be caught if you gather database statistics at the correct moments.
Table information
Let’s take look at another sample output from IBAnalyst..jpg)
Figure 2 Table statistics
The IBAnalyst Table statistics view is also very useful. It can show which tables have a lot of record versions, where a large number of updates/deletes were made, fragmented tables, with fragmentation caused by update/delete or by blobs, and so on. You can see which tables are being updated frequently, and what the table size is in megabytes. Most of these warnings are customizable.
In this database example there are several problems. First of all, yellow color in the VerLen column warns that space taken by record versions is larger than that occupied by the records themselves. This can result from updating a lot of fields in a record or by bulk deletes. See the rows in which MaxVers column is marked in blue. This shows that only one version per record is stored and consequently that the problem is due to bulk deletes. The value in the Versions column shows how many records were deleted.
Long-living active transactions preventing garbage collection is the main reason for performance degradation. For some tables there can be a lot of versions that are still “in use”. The server can not decide whether they really are in use, because active transactions potentially need any one or all of these versions. Accordingly, the server does not consider these versions as garbage, and it takes longer and longer to construct a correct record from lot of versions whenever a transaction happens to read it. In Figure 2 you can see two tables that have the versions count three times higher than the record count. Using this information you can also check whether the fact that your applications are updating these tables so frequently is by design or because of an error.
The Index view
Indices are the used by database engine to enforce primary key, foreign key and unique constraints. They also speed up the retrieval of data. Unique indices are the best for retrieving data, but the level of benefit from non-unique indices depends on the diversity of the indexed data.For example, look at ADDR_ADDRESS_IDX6. First of all, the index name itself suggests that it was created manually. If statistics were taken by the Services API with metadata info, you can see what columns are indexed (in IBAnalyst 1.83 and greater). For the index under examination you can see that it has 34999 keys, TotalDup is 34995 and MaxDup is 25056. Both duplicate columns are marked in red. This is because there are only 4 unique key values amongst all the keys in this index, as can be seen from the Uniques column. Furthermore, the greatest duplicate chain (key pointing to records with the same column value) is 25056 - i.e. almost all keys store one of four unique values. As a result, this index could:
- Reduce the speed of the restore process. Okay, thirty-five thousand keys is not a big deal for modern databases and hardware, but the impact should be noted anyway.
- Slow down garbage collection. Indices with a low count of unique values can impede garbage collection by up to ten times in comparison with a completely unique index. This problem has been solved in InterBase 7.1/7.5 and Firebird 2.0.
- Produce unnecessary page reads when the optimizer reads the index. It depends on the value being searched in a particular query - searching by an index that has a larger value for MaxDup will be slower. Searching by value on a column that has fewer duplicate values will be faster, but only you know that the column is indexed.
Reports
There is no need to look through the entire report each time, spotting cell color and reading hints for new warnings. More direct and detailed information can be had by using the Recommendations feature of IBAnalyst. Just load the statistics and go to the Reports/View Recommendations menu. This report provides a step-by-step analysis, including more detailed descriptive warnings about forced writes, sweep interval, database activity, transaction state, database page size, sweeping, transaction inventory pages, fragmented tables, tables with lot of record versions, massive deletes/updates, deep indices, optimizer-unfriendly indices, useless indices and even empty tables. All of this information and the accompanying suggestions are dynamically created based on the statistics being loaded.As an example of the report output, let’s have a look at a report generated for the database statistics you saw earlier in this article:
“Overall size of transaction inventory pages (TIP) is big - 94 kilobytes or 23 pages. Read_committed transaction uses global TIP, but snapshot transactions make own copies of TIP in memory. Big TIP size can slowdown performance. Try to run sweep manually (gfix -sweep) to decrease TIP size. “
Here is another quote from table/indices part of report:
“Versioned tables count: 8. Large amount of record versions usually slowdown performance. If there are a lot of record versions in table, than garbage collection does not work, or records are not being read by any select statement. You can try select count(*) on that tables to enforce garbage collection, but this can take long time (if there are lot of versions and non-unique indices exist) and can be unsuccessful if there is at least one transaction interested in these versions.
Here is the list of tables with version/record ratio greater than 3 :
| Table | Recpords | Versions | Rec/Vers size |
| CLIENTS_PR | 3388 | 10944 | 92% |
| DICT_PRICE | 30 | 1992 | 45% |
| DOCS | 9 | 2225 | 64% |
| N_PART | 13835 | 72594 | 83% |
| REGISTR_NC | 241 | 4085 | 56% |
| SKL_NC | 1640 | 7736 | 170% |
| STAT_QUICK | 17649 | 85062 | 110% |
| UO_LOCK | 283 | 8490 | 144% |
Summary
IBAnalyst is an invaluable tool that assists a user in performing detailed analysis of Firebird or InterBase database statistics and identifying possible problems with a database in terms of performance, maintenance and how an application interacts with the database. It takes cryptic database statistics and displays them in an easy-to-understand, graphical manner and will automatically make sensible suggestions about improving database performance and easing database maintenance.1 InterBase 7.5 and Firebird 1.5 have special features that can periodically flush unsaved pages if Forced Writes is Off.
2 Oldest transaction is the same Oldest interesting transaction, mentioned everywhere. Gstat output does not show this transaction as “interesting”.
3 Ann Harrison says that Oldest active as an oldest transaction that was active when current oldest active transaction started. For applications this is not a big difference here.