 en
en br
brCentralized HQbird Monitoring
HQbird Control Center Monitoring is a part of HQbird. HQbird users can link their HQbirds to the public “HQbird Control Center”, or to the private HQbird Control Center (it is delivered by request for users with Unlimited License or with more than 10 licenses).
Contents
- Short overview of HQbird's Advanced Monitoring for Firebird
- How to link your HQbird instance to public "HQbir Control Center" or to the private Control Center.
Short overview of HQbird's Advanced Monitoring for Firebird SQL
 Firebird engine has several ways to gather information about Firebird performance and functioning: Trace API, MON$ tables, utilities fb_lock_print and gstat -h, firebird.log file.
HQbird's Advanced Monitoring toolset uses all of them and provides the full picture of the performance for Firebird server and databases.
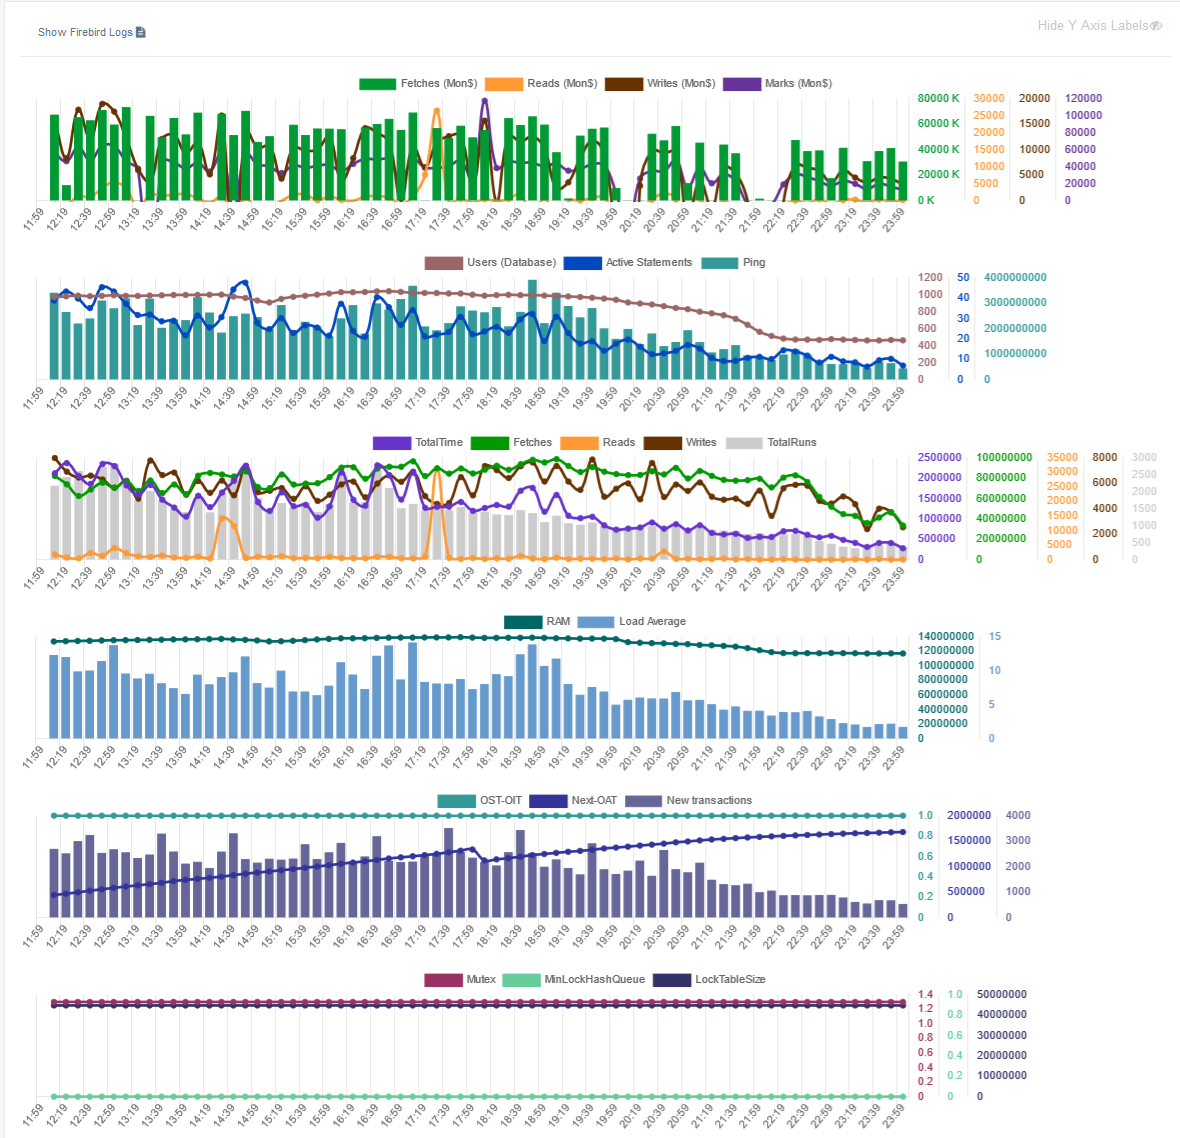
The following data are gathered and presented on the graphs:
- IO metrics: reads (from disk/file cache of OS), writes (to disk/file cache of OS), fetches (correspond to CPU load), and marks (correspond to cache flushing activity).
- Load metrics: Users, Active queries and Ping. For each database monitored we keep the number of users, connected to the database, number of simultaneously active queries and value of SQL ping.
- Queries metrics: number of queries executed per minute, total execution time of queries, number of fetches, reads. writes, marks for queries.
- Computer/VM load metrics: RAM usage and CPU load for Windows or Load Average for Linux. Computer/VM load metrics give the understanding how Firebird load corresponds with actual usage of computer resources.
- Transactions metrics. The 3 main transactions metrics give the quick insight is anything wrong with transactions management in the database: Next-OAT difference to check if there are long running active writeable transactions which hold garbage records versions, OST-OIT difference shows how many transactions are pending sweep, and number of new transactions per minute gives the good clue if there is a problem with too frequent transactions.
- Lock table metrics: Mutexes to see the percentage of waiting for shared objects, size of the lock table to see the actual consumption of memory for lock table, and minimal length of hash slots chain. These metrics are important for firebird.conf tuning and high-load performance.
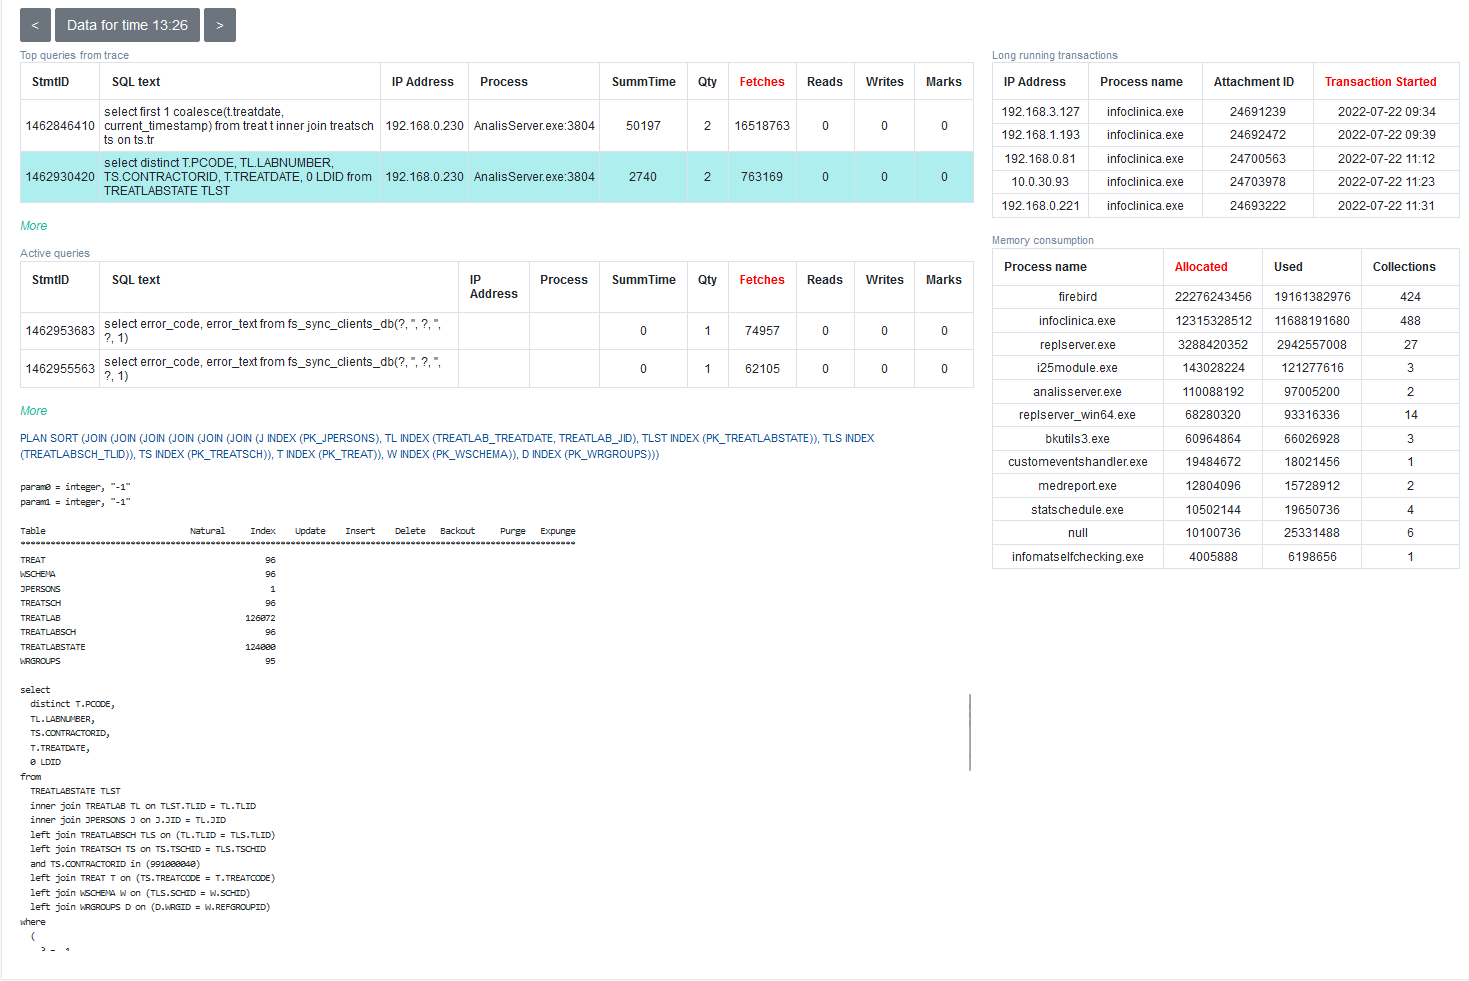
- Top of SQL queries for the current minute (threshold by default is 200 ms), by default it is sorted by fetches (which correspond to CPU load), but can be sorted by the time, reads, writes, marks. We can see IP address/name of the computer started the query, SQL query text, plan, statistics and parameters.
- Top of long-running active transactions with their start times and applications which started them (name and IP address).
- List of client processes connected to the database: name of the application, quantity of connections, memory sizes (consumed and allocated).
- Full query text
- Execution statistics
- Plan
- Parameteres
How to link your HQbird instance to the public "HQbird Control Center" or to the private Control Center.
1.1. Register on “HQbird Control Center” to get file keyanswers.txt
In order to use the advanced monitoring, you need to create free account on the portal “HQbird Control Center”: https://cc.ib-aid.com/, and then download file keyanswers.txt to link your account and servers.For users who use private Control Center, the appropriate account must be created by the administrator.
1.1.1. Steps to register
1. Open https://cc.ib-aid.com/ and click Create new account: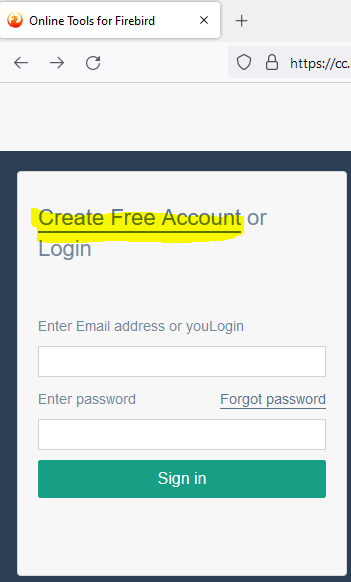
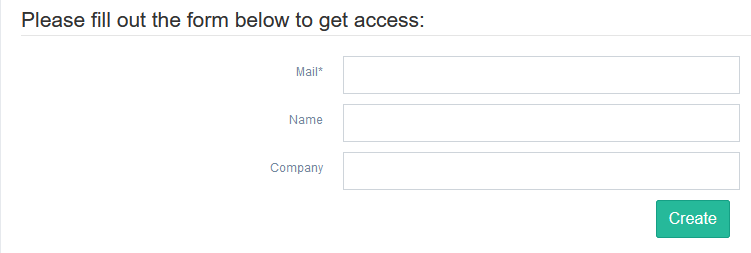
2. Then, specify the valid email, username and company (optional):
3. After that, wait 2-3 minutes to receive confirmation email, and click on confirmation link. It will open the form, where you need to enter password and its confirmation, after that you can login to “HQbird Control Center” portal.
1.1.2. Download keyanswers.txt
After login you will see the widget “HQbird Control Center Integration”Click to Download file keyanswers.txt.
File keyanswers.txt contains necessary information to link Control Center account and Advanced Monitoring then proceed with the installation.
1.2. Link HQbird instance to “HQbird Control Center” to cc.ib-aid.com or to your private HQbird Control Center
If you have the license of HQbird (from v.2022), you can send the data from your HQbird instance to our cloud instance ("HQbird Control Cnter") or to your private Control Center.For this, open your HQbird web-console (http://localhost:8082 by default), and click on the icon "Control Center integration" in the upper right corner:

After that you will see the dialog to upload file keyanswers.txt (you can obtain from the Control Center (https://cc.ib-aid.com) in the way described above, in 1.1 ). Click on button "Choose HQbird Control Center access point (keyanswers.txt)"
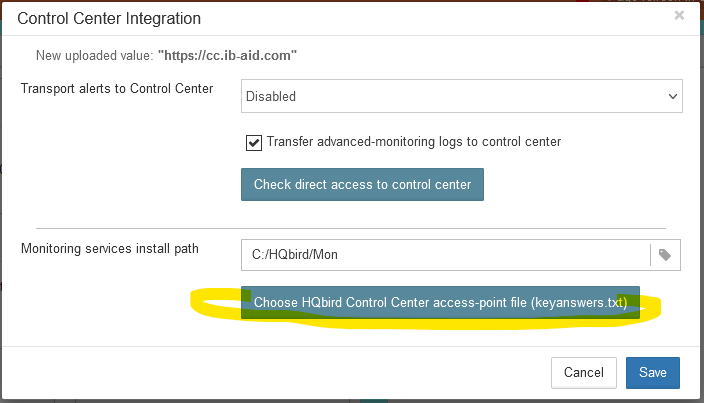
In case of succesfull connection, you can check the access to the Control Center by clicking button "Check direct access to control center".
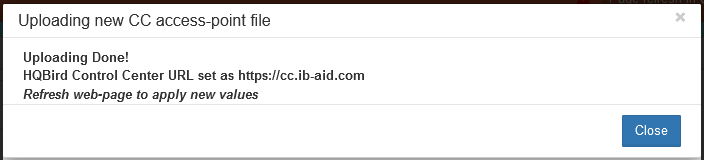
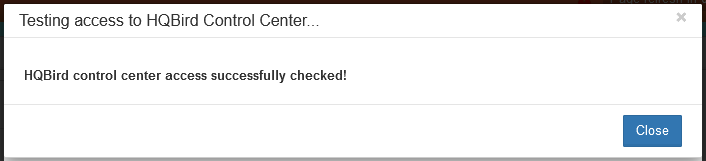
There should be the following message as a result of direct access check:
If there will be any error, please check access - there should be open ports for outcoing connections to ports 80 and 18080.
As a result, you will see in your Control Center account your server (as it is registered in HQbird). Please note: there can be delay to see new data up to 5 minutes!
There will be alerts and messages about backups, performance problems, etc. Also, when clicking to "Graphs", you will see data from Advanced Firebird Monitoring (which are also available locally in Advanced Monitoring Viewer) from HQbird in the "HQbird Control Center" (cc.ib-aid.com) or in your private Control Center:
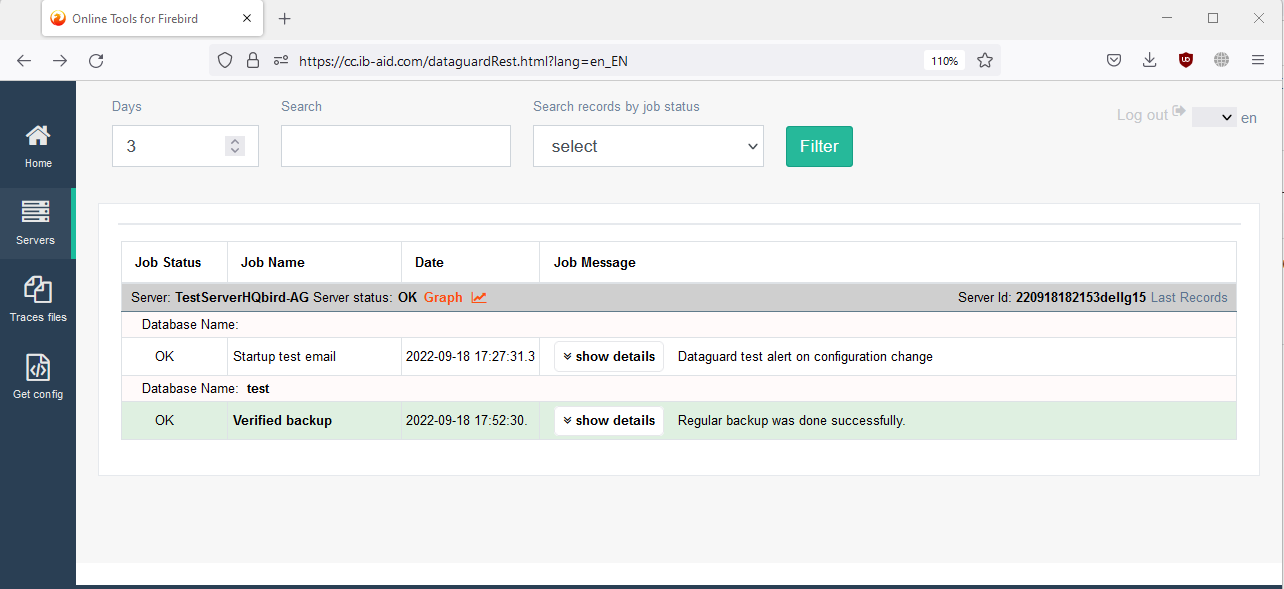
So it will be possible to review the statuses of many servers on the same page, and drill down into the performance problems in the centralized way.
Please contact us with any questions: [email protected]