IBSurgeon Free Tools
IBSurgeon Free Tools is a pack of three Windows utilities for Firebird and InterBase administrators: measure query response time, inspect how a database file is filled, and read long server logs. The pack is free, and it is also included in HQbird Standard.
What is in the pack
Response Checker
Run a real SELECT on a schedule and chart average and peak response time, so you can see when the database is slow.
DBInfo
Read the database file (no server required) and show how much space is data, indices, blobs, and other page types - and flag damaged pages.
Log Viewer
Open long firebird.log / interbase.log files, jump around entries, and spot peaks and consistency-check errors.
Response Checker
End users talk about “slow” and “good enough” - that is response time. Measure it with a heavy SELECT from your real application, against production or a close test copy. Abstract benchmarks without that query do not tell you when your users wait.
Response Checker runs that query on an interval, records each duration, and plots the timeline so you can see slow periods. Pair those windows with HQbird statistics (IBAnalyst, transaction monitoring, tracing) to find the cause. For a full engagement see the optimization service.
- Start IBSurgeon → FreeTools → IBSurgeon Response Checker.
- Paste a real-world
SELECT(not INSERT/UPDATE/DELETE). - Set the interval (default 10 seconds) and how many points to keep (default 17,280 ≈ 48 hours).
- Enable Disconnect after each check so each run uses a new connection, closer to end-user behaviour.
- Click Start Check and pick the database. Watch the graph for slow windows.
Results are in-session only: Stop Check then Start Check again clears the previous run.


DBInfo
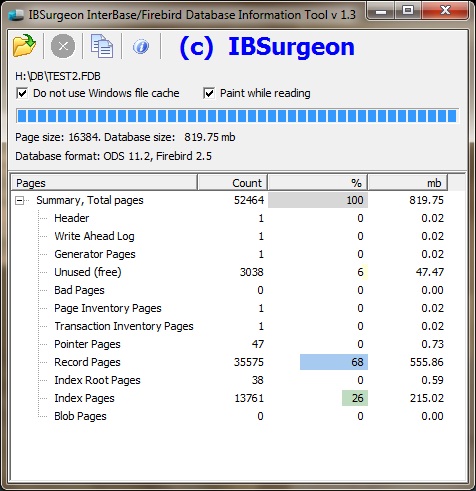
DBInfo opens the database file directly (read-only, no client library) and shows page size, file size, ODS format, and the mix of data, index, blob, and other pages. Red on the bars means bad pages, not “interesting” blob percentage - other colours are only visual.
- Which versions?
- InterBase 4.0 through current InterBase, and Firebird from 1.0 onward. It reads the file; the server does not need to be running.
- Remote or Linux?
- Windows Win32. The file must be reachable locally or via a network share (Wine is possible). It cannot talk to a remote server over the Firebird protocol.
- While the server is up?
- Yes, but a full-file scan hits the disk - avoid peak load. If the file is being written, DBInfo may report a false corruption warning.
- Can it write or corrupt the file?
- No. The file is opened read-only.
- Bad pages found?
- Run
gfixand FirstAID Diagnostician and send the log to [email protected]. We can repair it with the recovery service or you can license FirstAID. - Space per table or index?
- Use IBAnalyst (in HQbird Standard) for per-relation statistics and tuning notes.
- “Do not use Windows file cache”?
- On by default. Caching a multi-gigabyte scan can push other processes into virtual memory. Skipping the cache keeps large (1-100 GB) scans from slowing the whole machine.
Log Viewer
firebird.log / interbase.log often sit unread, yet they explain lockups, I/O errors, and engine bugs. Log Viewer was built in-house to navigate very long logs; version 2.0 shipped with entry descriptions for the community.
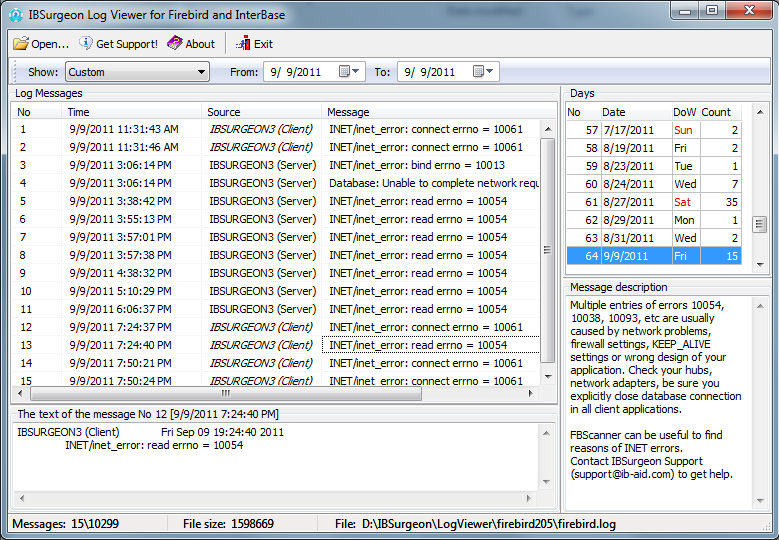
Open the log from the Firebird folder (typically C:\Program Files\Firebird\Firebird_n_n\). Watch the number of entries per day - a spike is a clue - then unusual lines, especially internal gds consistency check or internal Firebird consistency check.
If something looks wrong, email [email protected] and attach the log.